
Water and Wastewater Rates
Consultation has concluded
Update: The water and wastewater rates for the period of 2022-2026 were approved through a by-law at the December 14, 2021 meeting of Council. The final by-law can be read in the "important links" section to the right.
Water and wastewater rates are approved by Council every five years and are an important part of The County's legislated water financial plan. In late 2021, Prince Edward County Council will approve the water and wastewater rates for the period of 2022-2026.
Water and wastewater rates dictate how much you pay for the water that you consume at your home, business or a bulk water station, as well as your base connection charge. Wastewater rates are tied to your water consumption.
Committee of the Whole directed staff to undertake public consultation on four water rate scenarios that were presented for consideration. We want to hear your thoughts on which rate scenario makes the most sense for our community.
- Do we pay more for water in the short term, or take on debt in favour of a slower rate increase?
- How quickly should we try to achieve "full lifecycle funding" of our utility through water rates?
- Should rates increase across the board or be tied to certain types of water usage?
This is a big decision that will not only impact water users on a day to day basis but also our infrastructure for decades to come. Let's make an informed decision together!
How does The County determine water rates?
Water and wastewater rates are influenced by a complex set of variables including the number and type of water system users, projected population and housing growth, how much water our community uses, provincial legislation, our future infrastructure needs, our financing options and more. When specialized consultants work with a municipality to recommend water rates, they take all of these factors into consideration.
 Image description: A graphic that shows the various factors that influence water rates including capital needs (new infrastructure, infrastructure upgrades and maintenance), growth projections (projected housing development, population growth), financing options (reserves, development charges, MAT, debt, grants), water system users (How many? What type? i.e. residential, commercial, industrial), legislation (Safe Drinking Water Act, Municipal Act)
Background on rate study:
A water rate study was conducted by Watson & Associates and was presented to Committee of the Whole in August 2021. The rate study informs the rate scenarios and takes into consideration our local context, growth projections, funding options and infrastructure needs among other variables. The following resources are available for those looking for technical information about The County's water and wastewater utility and the water rates study:
- Presentation from Watson & Associates to Committee of the Whole on the rate study and recommendations
- Technical findings report from Watson & Associates
- Slides from Watson & Associates presentation
You can also request a technical visit to one of The County's water or wastewater plants. These visits are an opportunity to see the infrastructure and the investments needed and include a Q&A with water and wastewater staff. To book a technical visit, email communications@pecounty.on.ca.
Key variables for The County's water rates:
There are some key variables that impact The County's water and wastewater rates and are accounted for in the rate study:
- Size of drinking water system: We have a relatively small number of users that support six systems spread throughout The County. While our neighbouring municipalities might have 20,000 connections supporting the costs of two plants, The County has approximately 5,000 connections supporting six drinking water systems and two wastewater treatment plants. We also have very few large commercial or industrial water users, which tend to drive down water rates for all users through their high consumption and large base connection charges. The County also has an agreement with the City of Belleville to provide water to our Rossmore/Fenwood system at a premium price to County water users. These factors contribute to the relatively high water rates we already have in The County.
- Infrastructure needs: Like most municipalities in Ontario, The County's water and wastewater infrastructure is in need of renewal. Our rate scenarios must factor in the large infrastructure investments we'll make in the next two decades - it is a best practice to consider "full lifecycle funding" of our infrastructure when setting rates, and start saving now to avoid costly surprises down the road. (More on this later...)
- Growth projections: There is significant growth projected in The County's towns over the next five years, particularly in the village of Wellington. Growth can help to keep water and wastewater prices down by increasing the number of connections and users and spreading the costs over more houses. The County is confident in the growth projections included in this rate study, particularly because developers have started to enter upfront financing agreements with The County. This means they have put their "money where their mouth is" and have made real commitments to these future developments.
Will our rates increase?
The short answer is yes. Water and wastewater rates would increase under any of the proposed rate scenarios.
Rates must increase in order to properly manage our water and wastewater system and to ensure clean, safe water for the public now and for future generations. Increased rates will not be unique to The County. Most of Ontario's municipalities will need similar infrastructure renewal and operating cost increases soon.
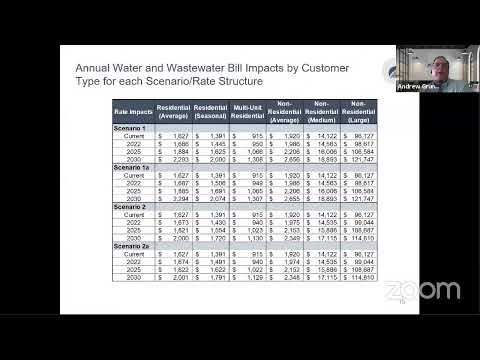
The four rate scenarios offer us different options for how much and how quickly our rates will increase, how quickly we can achieve "full lifecycle funding" of our infrastructure, and how the costs are distributed among different types of water users.
For more information on the four rate scenarios, see the "Forum" tool below.
What is "full lifecycle funding"?
Each water rate scenario tries to achieve "full lifecycle funding" of our water and wastewater utility within a defined time frame. Budgeting for full lifecycle funding is an important best practice in infrastructure management. It means that we have considered the full costs of acquiring, operating, maintaining and disposing of water and wastewater infrastructure and have proposed rates that can fund these costs over time. It means that we are budgeting now to avoid costly surprises in the future.
 Image description: A graphic that illustrates the concept of full lifecycle funding. Text on image says "Full life-cycle funding. Budgeting for the full costs of acquiring, operating, maintaining and disposing of water and wastewater infrastructure. Acquire: The costs associated with buying or building new assets. Operate: The costs associated with operating the asset through its useful life. Maintain: The costs associated with maintaining and repairing the asset. Dispose: The costs associated with decommissioning and disposing of the asset."
Next Steps:
- Review the four rate scenarios in the Forum below. Use the tool to ask questions as needed.
- Save the dates for information events and feedback opportunities (see Key Dates to the right)
- Take the water rate survey online before October 20. The survey is also available to complete in person at Shire Hall or a County library. To increase the reach of our consultation efforts, staff will be hosting consultation pop-ups in towns with water and wastewater services. Take the survey in person in Picton, Bloomfield, Wellington, Ameliasburgh, Carrying Place, Consecon and Rossmore (see dates, times and locations in "Key Dates" to the right).
Videos
-
 Water rates discussion
-
 County staff present the findings of the water and wastewater rate study and the proposed rate scenarios.
-
 Watson & Associates presentation to Committee of the Whole, summarizing their findings form the water rates study and presenting rate scenarios.